Electricity sources
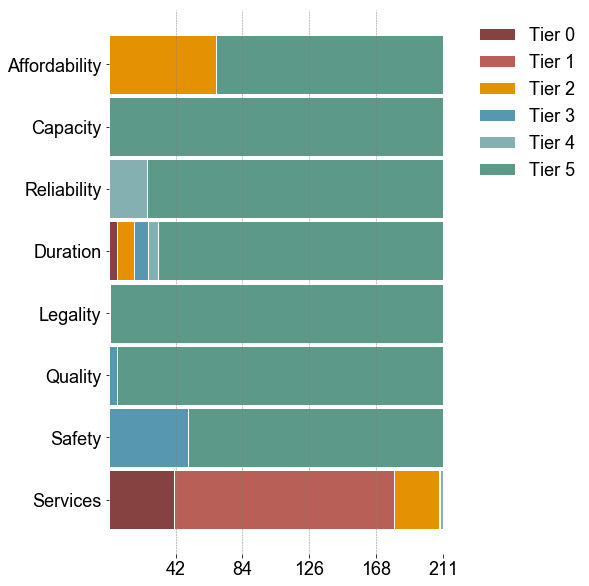
Attributes describing the access to electricity
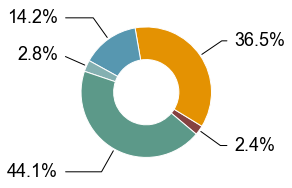
MTF Index (Access to electricity)
The MTF Index is given, for each household, by the minimum ranking among all considered attributes.
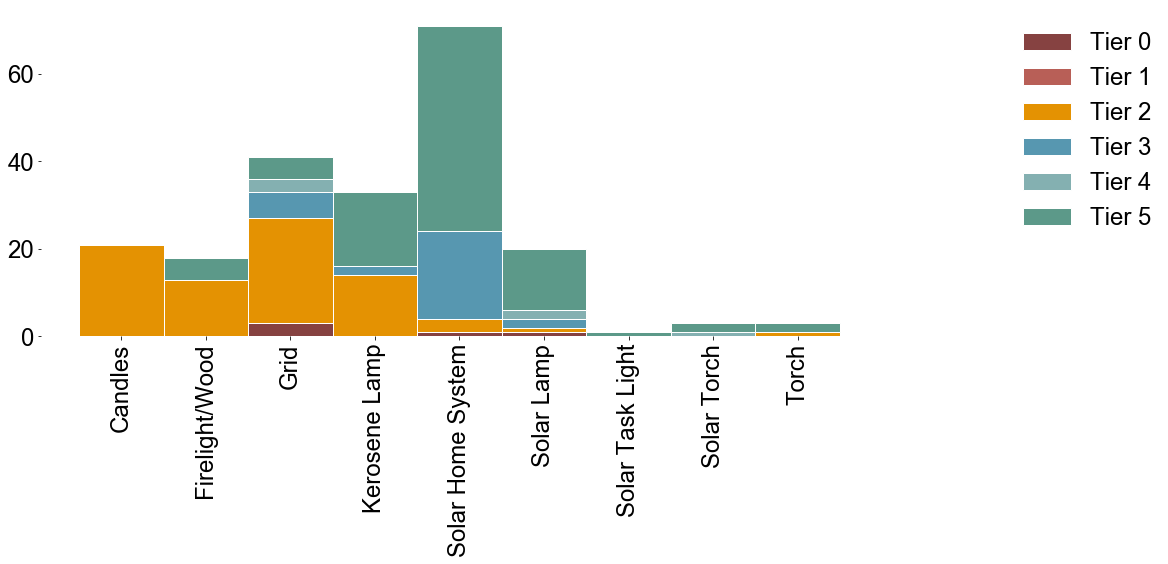
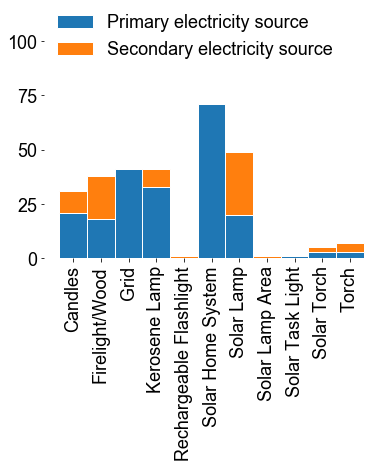
Electricity sources
Primary sources
Secondary sources
Primary and Secondary
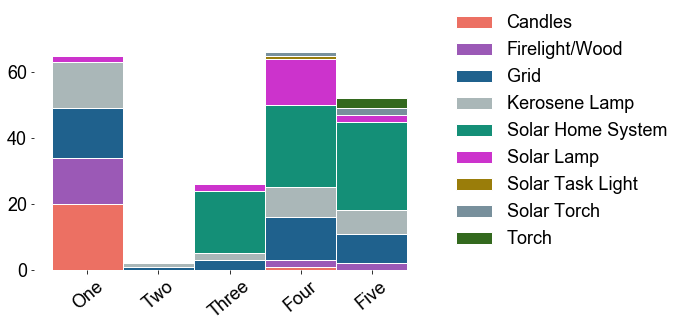
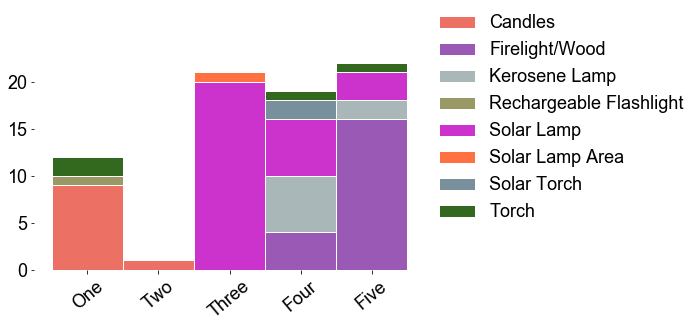
MTF Electricity Index vs. Primary Source