Household data (interactive analysis)
In this section it is possible to explore in detail where the survey has been implemented, and perform basic analysis on the collected data.
Map View
The Map allows to visualize the location of the collected GPS data. Missing data points are displayed with coordinated (0,0)
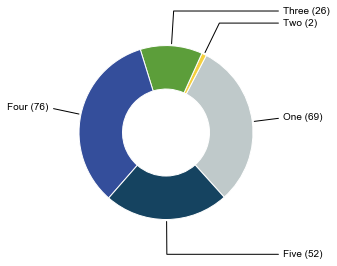
Collection overview
Data have been collected in five different locations.
Interactive Analysis
In this section it is possible to create different plots comparing the columns of the whole household database.
- Drag and drop each variable from the list on the left to the table on the right
- Select the type of plot/table